The plot panel can be docked to top or bottom of the documents area or it can be detached in its own window.
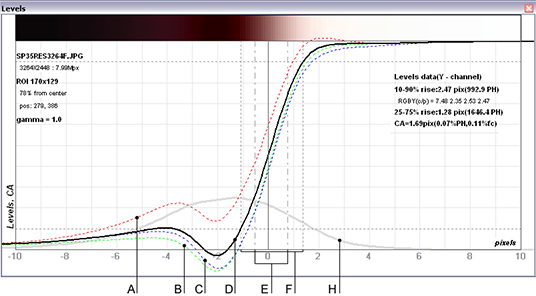
A, B, C, D - edge profiles for R, G, B and Y (luminance) channels. Bold line always corresponds to a current channel (see the Channel selection radio buttons).
E - rise distance by user defined range. In this case defined range is 25-75%
F - 10-90% rise distance in pixels
H - the area under this curve is proportional the chromatic aberration
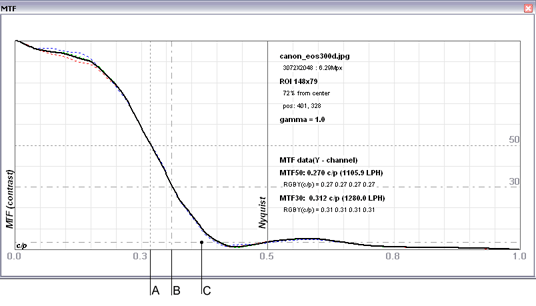
A - 50% contrast spatial frequency (MTF50)
B - spatial frequency by user defined contrast
C - MTF at Nyquist frequency (0.5 c/p)