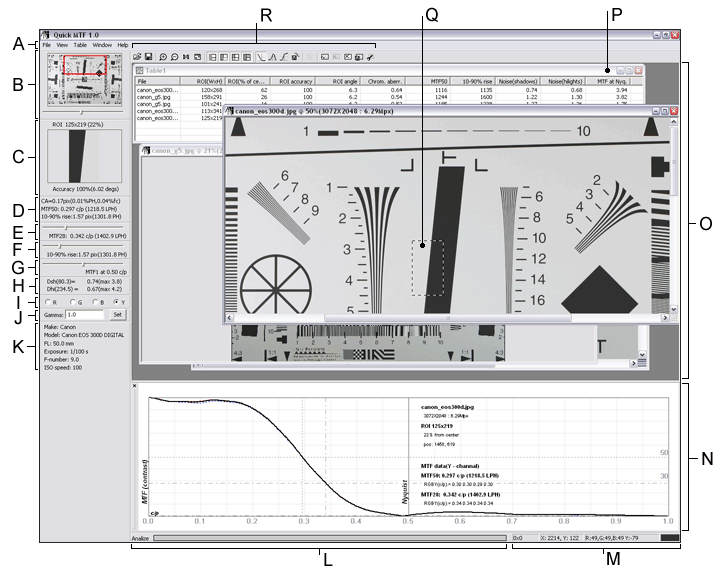

A – Main menu
B – Navigator – a thumbnail display to quickly change the field of view of the image
C – ROI (region of interest) info
D – Most important image quality measurements (chromatic aberration, MTF50, 10-90% edge rise distance in pixels)
E – The spatial frequency for user defined contrast
F – Rise distance by user defined range
G – Contrast for user defined spatial frequency
H – Noise measurements
I – Channel selection radio buttons
J – Gamma setting area
K – Selected EXIF data
L – The status bar. It usually displays hints, but it can also display the status of an operation taking a long time to complete, such as opening a large file
M – ROI size, mouse position and color under mouse cursor
N – Plot area. Depending on the current mode (see
the Toolbar) it can show edge spread function, SFR(spatial frequency response) also called MTF(modulation transfer function), or LSF(line spread function) plot
O – Area of opened documents
P – Table of measurements
Q – Current ROI in active document
R – Toolbar